Plot the distribution function for principal components
Usage
# S3 method for class 'apd_pca'
autoplot(object, ...)
Arguments
- object
An object produced by
apd_pca.- ...
An optional set of
dplyrselectors, such asdplyr::matches()ordplyr::starts_with()for selecting which variables should be shown in the plot.
Examples
library(ggplot2)
library(dplyr)
library(modeldata)
#>
#> Attaching package: ‘modeldata’
#> The following object is masked from ‘package:datasets’:
#>
#> penguins
data(biomass)
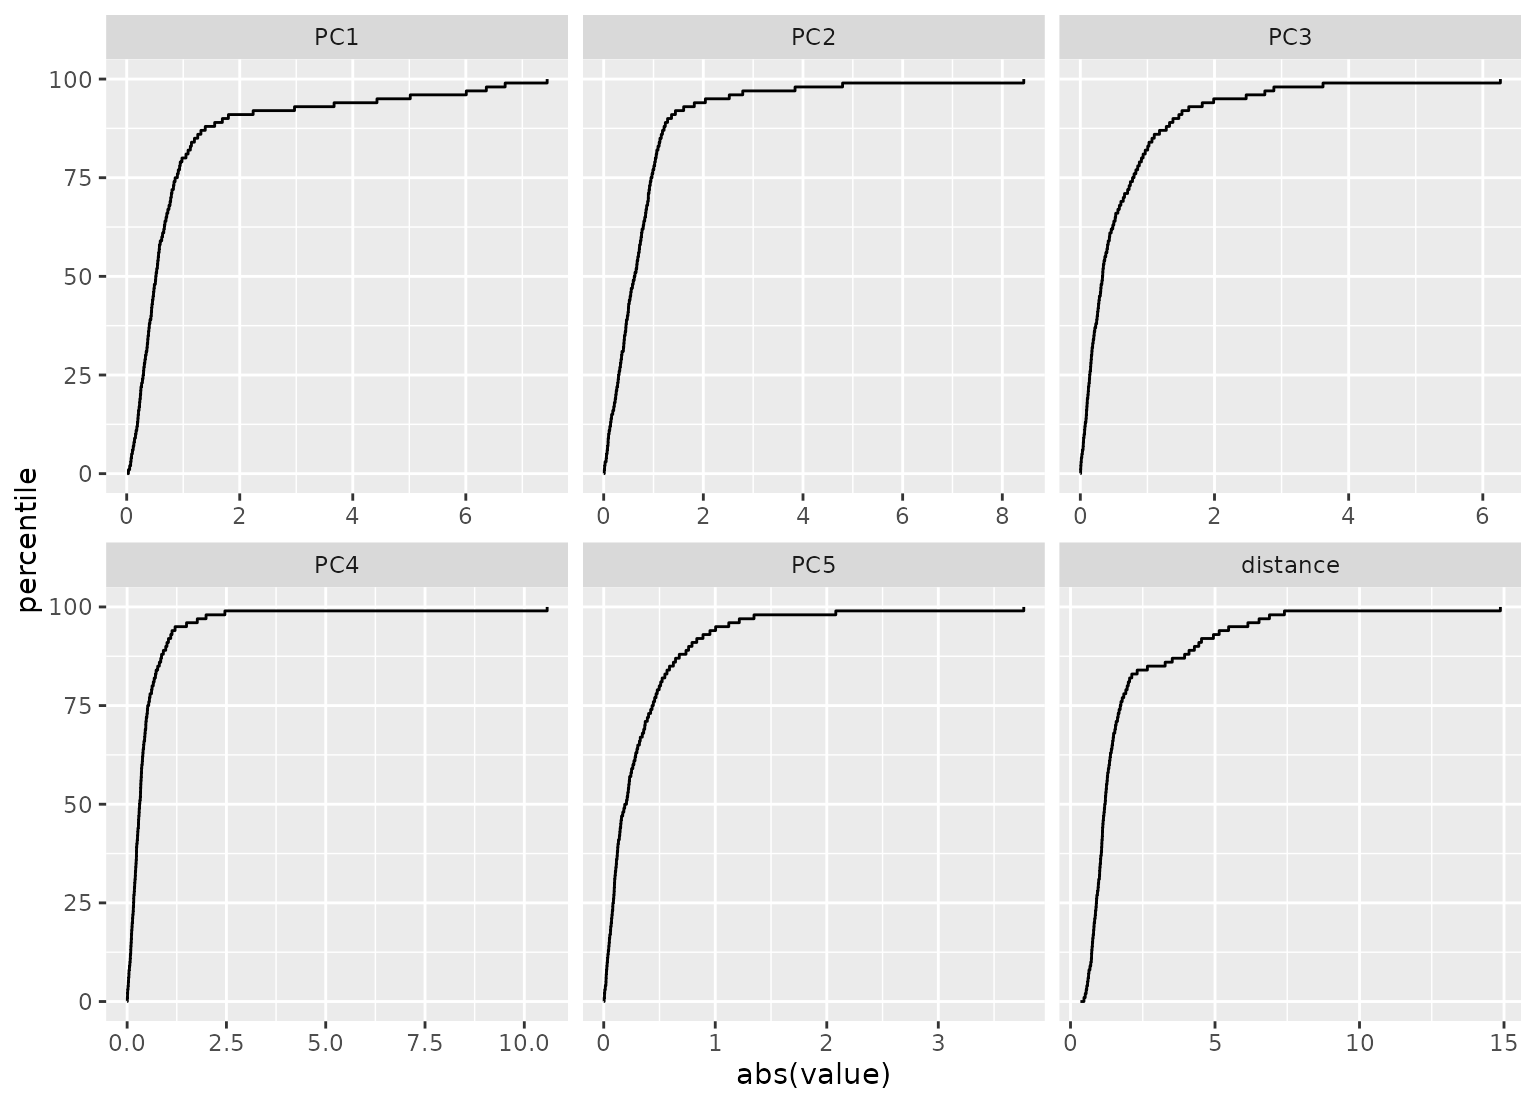
biomass_ad <- apd_pca(biomass[, 3:8])
autoplot(biomass_ad)
 # Using selectors in `...`
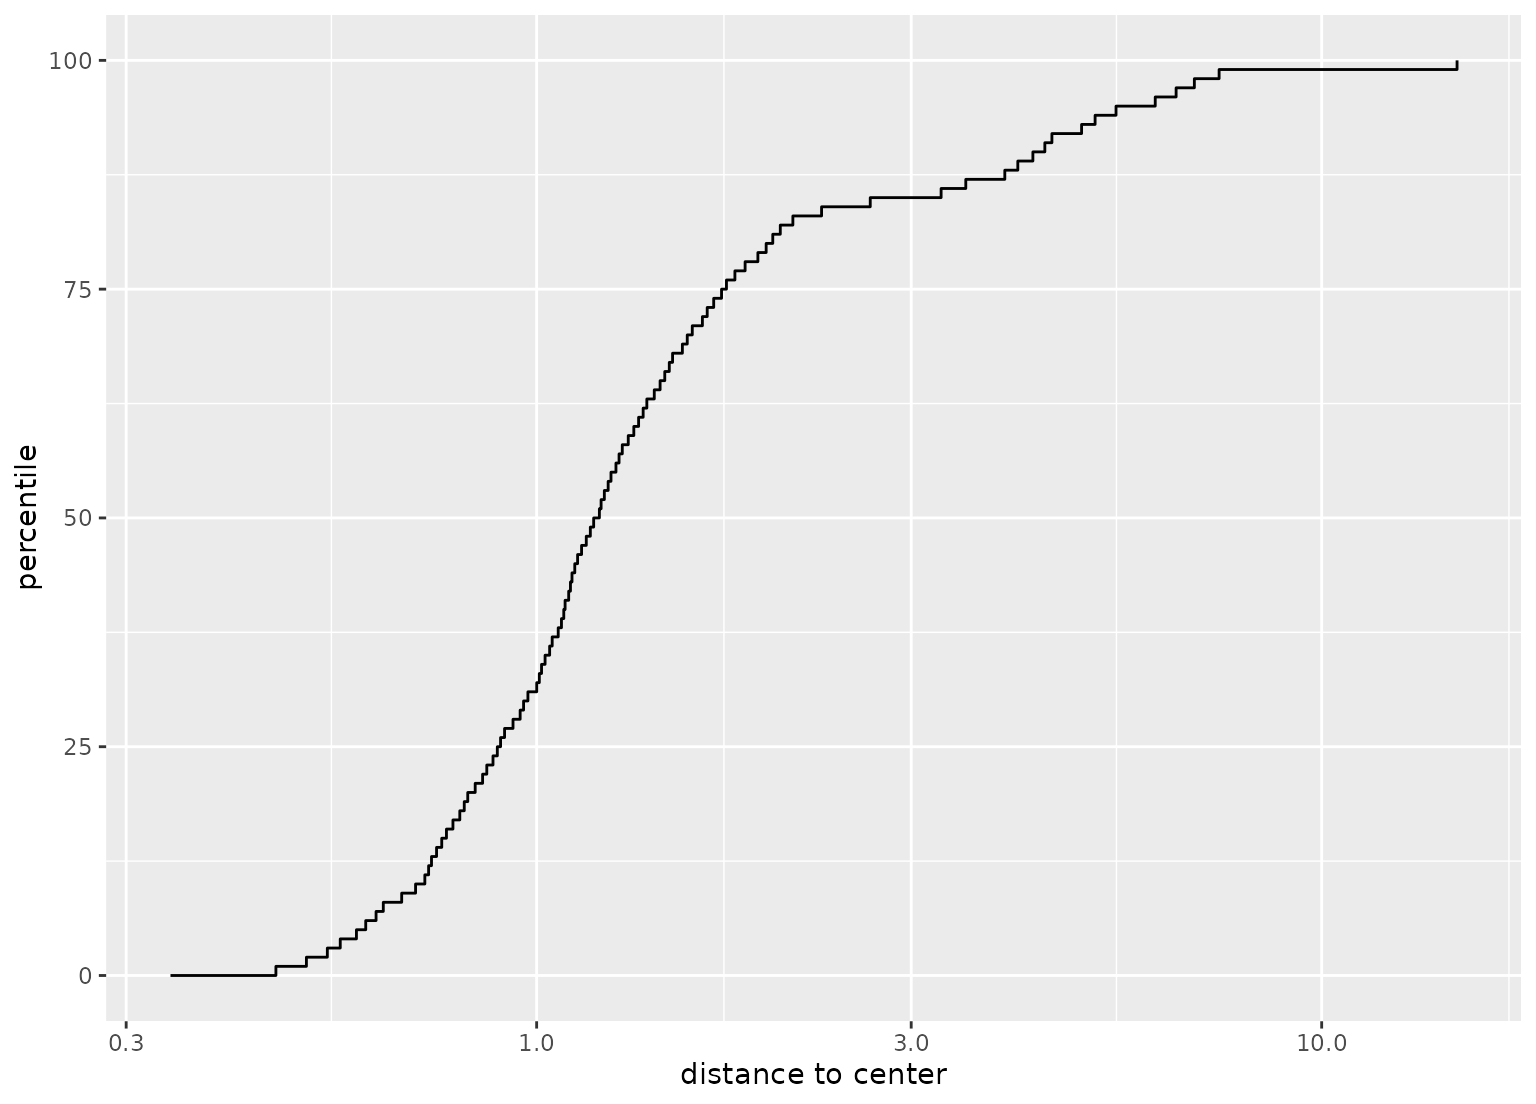
autoplot(biomass_ad, distance) + scale_x_log10()
# Using selectors in `...`
autoplot(biomass_ad, distance) + scale_x_log10()
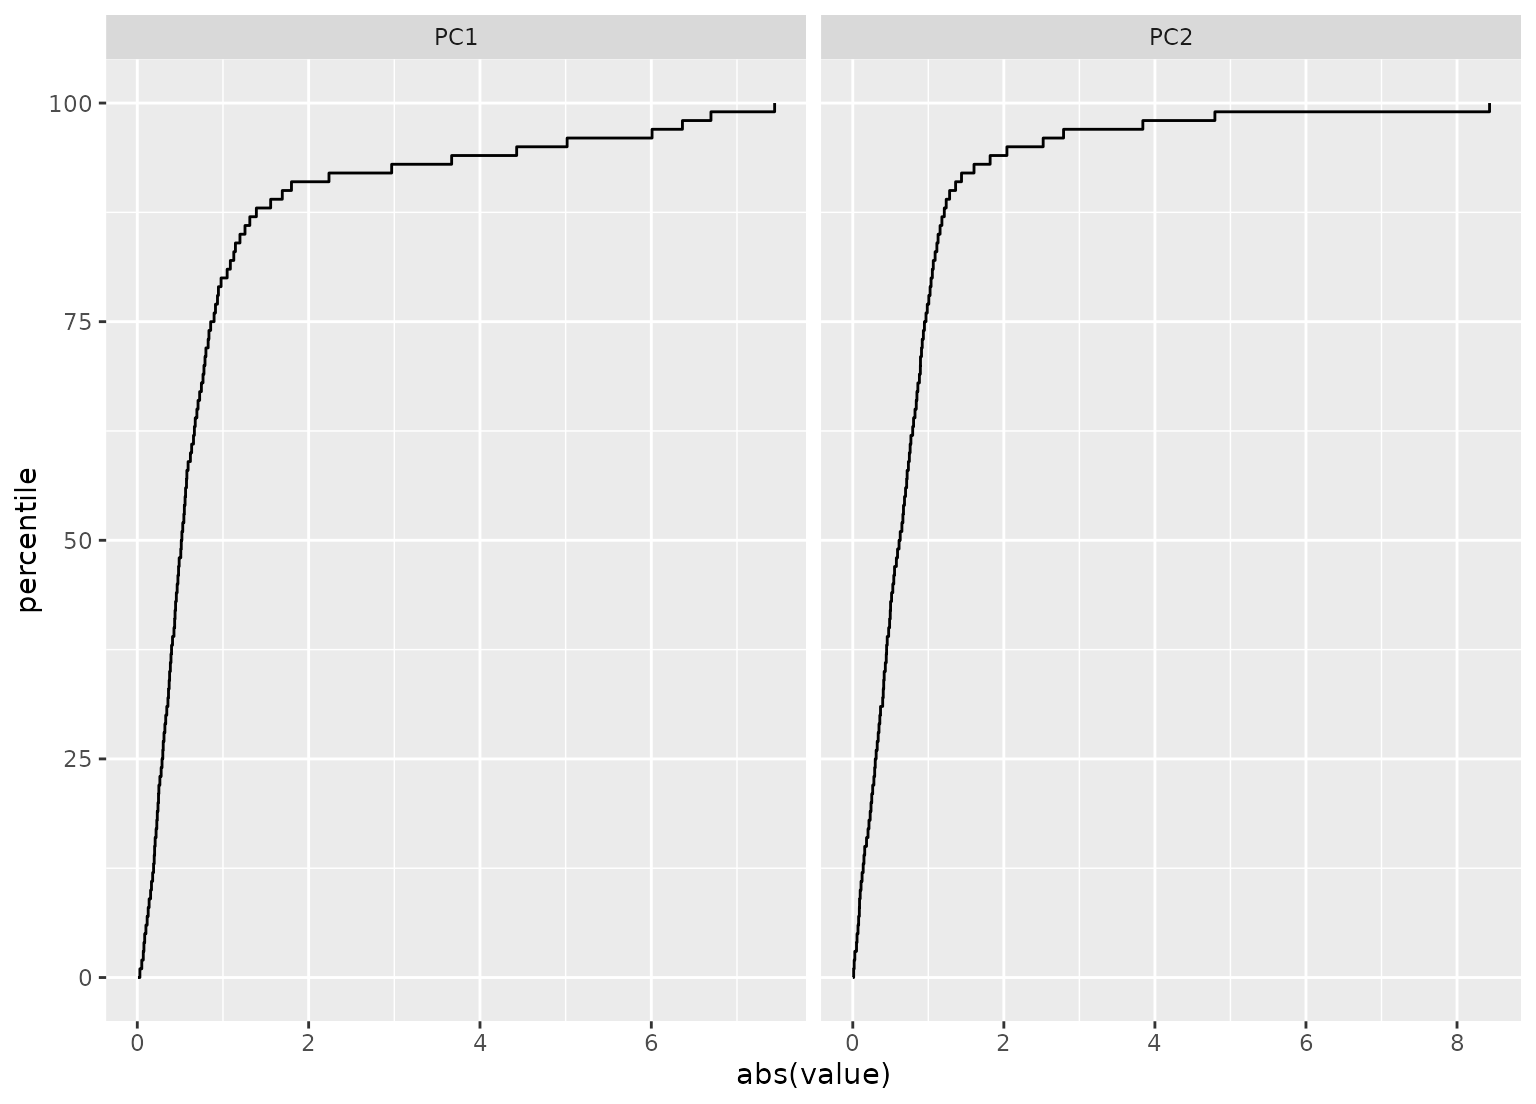
 autoplot(biomass_ad, matches("PC[1-2]"))